Process
Introduction
The aim of this research was to investigate what causes the sound of raindrops falling into water. We first read a few articles on raindrops and, more specifically, the sound they make. From what we could gather, the size of the drop should have an effect on the sound it makes when it hits the water surface. This was our starting point. We posed the following question: What effect, if any, does the size of a water droplet have on the sound it makes when it hits a surface of water. Of course, together with this question, we also posed a hypothesis: If the size of a water droplet increases, the amplitude as well as the frequency of the impact-sound will be affected.
Setup
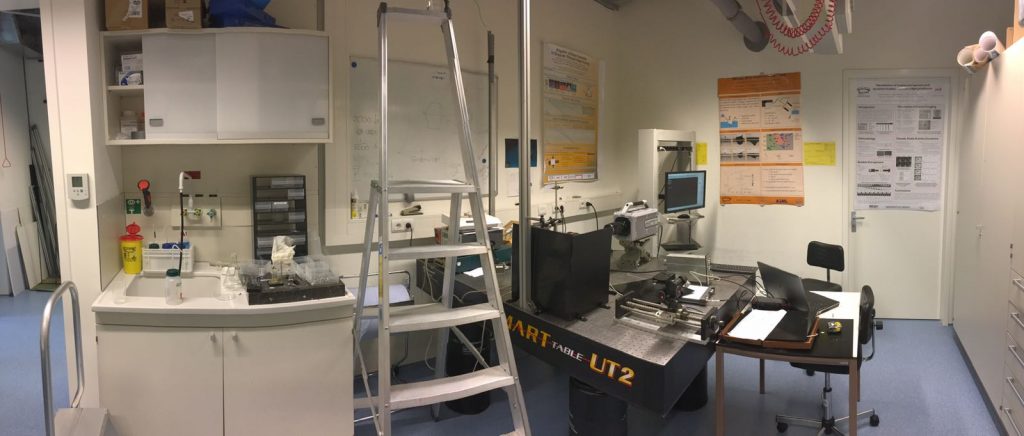
To test our hypothesis we needed to build a setup. The basic idea of the setup was to let droplets fall from a set height out of a syringe with a known needle-diameter. Increasing the diameter of the syringe also increases the drop size, which is the way we varied the drop size variable. To measure the sound of the impact, we used a hydrophone and to capture the impact on video we used a high speed camera. A more detailed description of the setup and how we built the setup can be found here.
Taking Measurements
After we had built our setup, we found it to be extremely difficult to get every drop to fall in the same place every time. Eventually though, we did manage to capture some usable data in the form of 3 drops of different sizes.
Large Drop
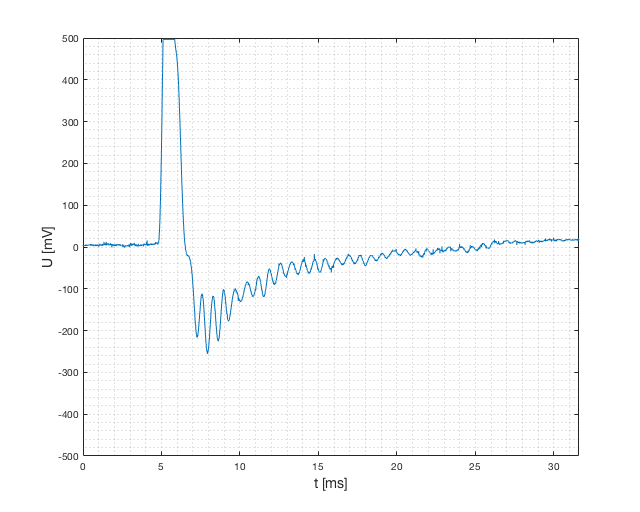
The largest drop gave us the most usable and clear data, which can be seen in the corresponding graph. In the graph we can clearly distinguish the impact as wel as another strong oscillation after the impact.
Medium Drop
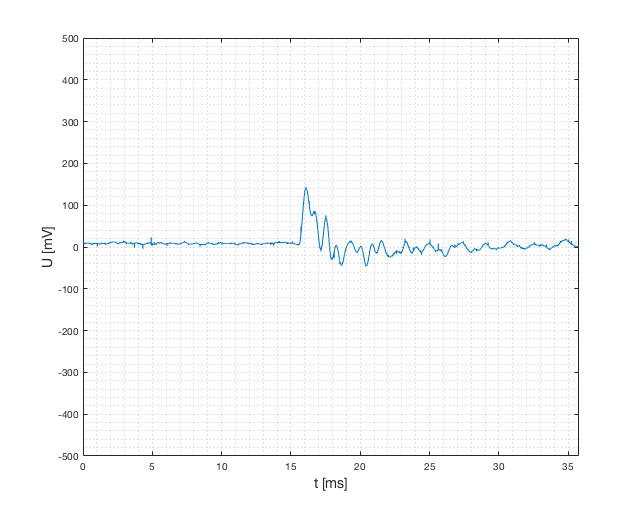
The Medium drop gave us a much less clear picture of what was happening. In it's graph we do clearly see an impact-spike as well as a subsequent oscillation, but this oscillation is not as clean as the large drop's oscillation.
Small Drop
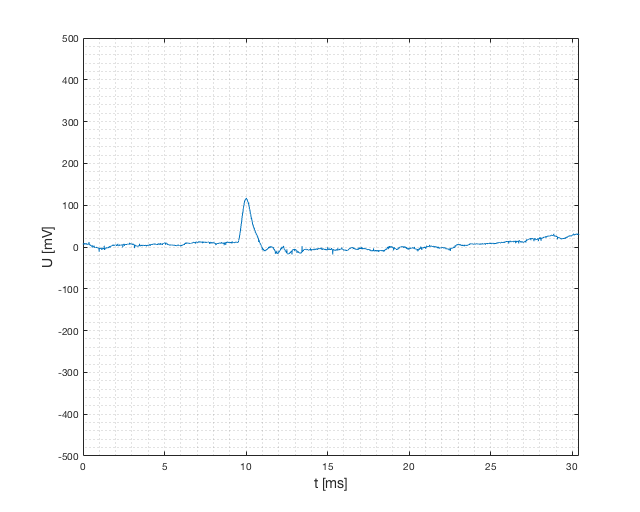
As we by now expected, the smallest drop also gave a small spike. The following oscillation was much less clean than the oscillation of the large size drop, as can be seen in the graph
Unfortunately these 3 drops were the only drops that we were able to capture and record, that also gave us usable data. We did not anticipate the large amounts of time that the lining up process and trying to get a drop to fall in a specific place would take. This led us to decide not to try and capture more drops, because of our limited time window for both capturing and processing our data.
Processing data and building site
When we finished up our measurements, some of us had already started working on the website. We first made an empty site with empty pages and designed a layout for these pages. We already made most of the layout without actually entering text or data, which was still being gathered at the time. When the measurements had finished up, the processing of the data could begin. This consisted out of a few parts:
- Doing a Fourier-Analysis on the sound, to determine the most abundant frequencies.
- Creating graphs for display and easy qualitative analysis of the measurements.
- Creating the animation required for displaying the camera footage next to the audio recording. In effect, this meant we had to animate a line being drawn and convert this animation into a video file.
The results we got from processing this data can be found here.
The raw footage, data and the Matlab programs we developed can be found here.